1.1 Statistics of unqualified products in ultrasonic flaw detection
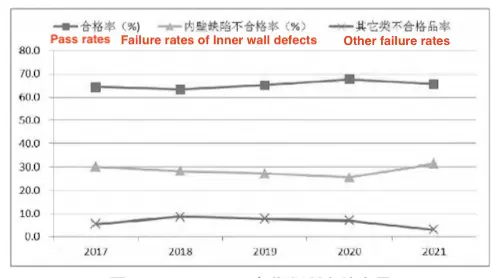
Figure 1 shows the statistical results of a company’s primary flaw detection pass rate for all aviation stainless steel pipes from 2017 to 2021. Since defects of the inner wall of the pipe cannot be visually inspected and can only be verified through destructive methods such as cutting; defects of the inner wall are listed separately. Among them, the proportion of qualified pipes is maintained at 60.0 to 70.0%, so the proportion of unqualified products due to inner wall defects is 20.0 to 30.0%; the proportion of other types of unqualified products (including outer wall scratches, dents, out-of-tolerance dimensions, bends and other defects) is below 10.0%. It can be seen that inner wall defects have become the main factor restricting the improvement of the pass rate.

Figure 1
1.2 Statistics of types of pipe inner wall defects
Since the most important thing in ultrasonic testing is to locate, quantify and characterize the reflector, these three must be the basic rules of ultrasonic flaw detection. Therefore, a total of 200 sets of samples were collected for the company's unqualified pipes with ultrasonic flaw detection on the inner wall from 2021 to 2022. The position of the inner wall defects was accurately located through ultrasonic flaw detection equipment, and then the pipes were sectioned and inspected using a scanning electron microscope. Statistics and classification of inner wall defects detected by ultrasonic flaw detection revealed that the types of inner wall defects are mainly divided into the following three categories:
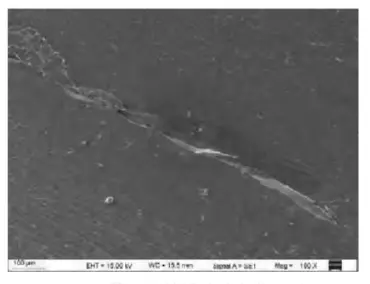
(1) The original defects of the tube blank remain
The representative characteristics of such defects are peeling or thorns on the inner wall. The electron microscope scanning morphology of the original defects left in the tube blank is shown in Figure 2.

Figure 2
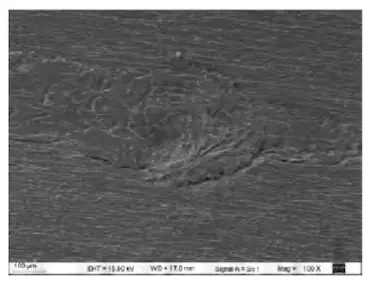
(2) Defects in the pipe’s rolling process

Figure 3
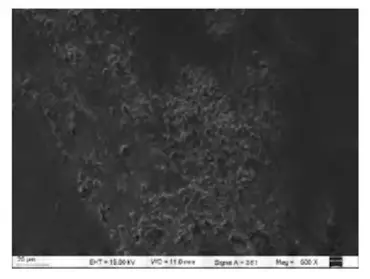
(3) The oil removal residue from the pipe and the sinter residue from solution treatment

Figure 4
The statistical results of the inner wall’s cutting sample data are shown in Table 1. Among them, defects due to rolling processing accounted for the highest proportion, 51%; followed by sintering after solution treatment and oil removal, accounting for 35%; original defects accounted for the smallest proportion, 14%.
Table 1 Statistical results of inner wall’s cutting sample data
| Items | Original defects | Rolling processing defects | Defects due to sintering after solution treatment and oil removal |
| Quantity/batch | 28 | 102 | 70 |
| Proportion/% | 14 | 51 | 35 |